How-To
Researchers Devise a New Machine Learning Algorithm for Dataset Similarity
Calculating dataset similarity is difficult but is useful for several scenarios and can potentially save millions of dollars in ML computing costs and even greatly reduce carbon footprints.
- By Pure AI Editors
- 04/08/2021
Researchers at Microsoft have demonstrated a simple but effective technique to compute a dataset similarity metric. The new metric is based on a combination of deep neural network architecture and classical statistics. The similarity metric is called AKLD, which stands for Autoencoded Kullback-Leibler Divergence.
A similarity metric between a dataset P and a dataset Q is a value that describes how similar (or equivalently, how different) the two datasets are. At first thought, dataset similarity doesn't seem particularly useful. Additionally, calculating dataset similarity doesn't seem like it would be a difficult problem. But dataset similarity is in fact a very useful metric and is very difficult to calculate.
Knowing the similarity between two datasets can be useful in many data science and machine learning (ML) scenarios. One example is determining which of several small subsets drawn from a huge set of parent training data is most similar to the parent. Another example is for use with ML transfer learning activities, such as using a prediction model trained on a small but similar subset of a large parent dataset to quickly train a second dataset.
There are many effective ways to compute the similarity between two individual data items. Examples include Euclidean distance and cosine similarity. However, calculating a similarity metric between two collections of data items is difficult for at least three reasons. First, brute force approaches that compare individual data items don't work for large datasets. Second, there's no effective way to deal with datasets that contain both numeric and non-numeric data. And third, there's no immediately obvious way to handle two datasets that have different sizes.
The terms similarity, distance, and divergence are closely related. In informal usage, the terms are sometimes used interchangeably. With a similarity metric, larger values mean more similar. The term similarity is often used as an umbrella term to refer to any kind of similarity, distance, or divergence metric. With a distance metric, larger values mean less similar. A distance metric is symmetric, which means distance(P, Q) = distance(Q, P). A divergence metric is like a distance metric but divergence isn't symmetric so divergence(P, Q) is not necessarily equal to divergence(Q, P).
Autoencoded Kullback-Leibler Divergence
The autoencoded Kullback-Leibler divergence (AKLD) metric uses a deep neural autoencoder to process all items in a reference dataset P and an "other" dataset Q, and then computes an average of Kullback-Leibler statistics. The technique is illustrated in Figure 1. First, an autoencoder is created based on the reference dataset P. An autoencoder learns to predict its own input. At the core of the autoencoder is a hidden, latent representation of a data item. In the diagram, the latent representation is a vector of n = 4 values, each between 0.0 and 1.0. The dimension of the latent representation is a free parameter. Each of the n values of the latent representation capture a different hidden attribute of the associated data item.
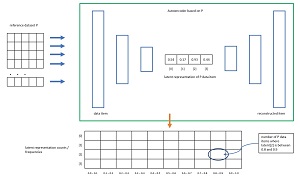 [Click on image for larger view.] Figure 1: Calculating Autoencoded Kullback-Leibler Dataset Divergence
After the autoencoder has been created, each of the data items in the reference dataset P is fed to the autoencoder. Each data item generates a latent representation. The latent values are binned into 10 frequency buckets, [0.0 to 0.1], [0.1 to 0.2], . . [0.9 to 1.0]. The result is n frequency vectors that define n probability distributions which represent all the data items in the reference P dataset.
Next, each of the items in the "other" dataset Q are sent to the autoencoder. This process generates n = 4 frequency vectors that define n probability distributions which represent all the data items in the Q dataset.
The Kullback-Leibler divergence (also called relative entropy), is a standard classical statistics metric. It is a measure of the difference between a reference probability distribution and a second "other" probability distribution.
The final step to compute the AKLD divergence between two datasets P and Q is to compute the Kullback-Leibler divergence for each of the n = 4 probability distributions generated by P and Q. This process yields 4 values where 0.0 indicates identical distributions, and larger values indicate less similar distributions. There is no upper bound on a Kullback-Leibler divergence metric because there is no upper limit on how different two probability distributions can be. The final AKLD divergence metric is the arithmetic mean of the n Kullback-Leibler metrics.
The AKLD measure of dataset similarity was developed by Z. Ma, J. McCaffrey, P. Mineiro, KC Tung, and RA Chavali. Dr. McCaffrey commented, "We needed a dataset similarity metric that can be used with all types of data -- numeric, non-numeric, and mixed. And we needed a metric that can scale to very large datasets. And we needed a metric that is simple to compute and understand. The AKLD metric was the result."
Applying Autoencoded Kullback-Leibler Divergence to the MNIST Dataset
The AKLD dataset similarity/divergence metric was tested on a wide range of datasets. One experiment applied AKLD to the well-known MNIST image dataset. MNIST (Modified National Institute of Standards and Technology) consists of 60,000 images for training a ML model, and 10,000 images for testing purposes. Each MNIST image is a single handwritten from '0' to '9'. Each image has 28 by 28 (784 total) grayscale pixel values between 0 and 255.
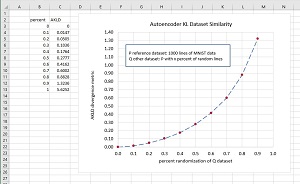 [Click on image for larger view.] Figure 2: Autoencoded Kullback-Leibler Applied to the MNIST Dataset
In one test, a reference dataset P was generated by selecting the first 1,000 training images. Ten "other" Q datasets were generated, ranging from no difference, to 10 percent of the images replaced by random pixel values, through 90 percent of images replaced by random pixel values. See the graph in Figure 2. As the Q dataset increased in difference from the P reference dataset, the value of the AKLD divergence metric increased in a smooth exponential growth curve as predicted by theory.
The screenshot in Figure 3 shows a test program written using the PyTorch neural network code library. The program run compares the 1000-item P dataset with a Q dataset where 400 data items (40 percent) have been randomized. The value of the AKLD metric is 0.1764 which corresponds to one of the data points on the graph in Figure 2.
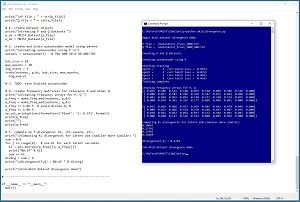 [Click on image for larger view.] Figure 3: Example of Computing Autoencoded Kullback-Leibler Divergence
What's the Point?
There has been recent increased interest in dataset similarity metrics. One of the primary motivations for the development of AKLD and other dataset similarity metrics is the growing cost of training huge ML models, especially natural language models. For example, it's estimated that the cost of computing time to train the GPT-3 language model is approximately $4.6 million dollars. And training even moderately sized language models can routinely cost tens of thousands of dollars. One possible solution is to find smaller but similar datasets to train. This requires a dataset similarity metric.
McCaffrey noted, "One of our original goals in developing AKLD was to support a project that generates coresets from large parent datasets." He added, "We later realized that in addition to having the potential to save millions of dollars in ML computing costs, smaller training datasets can also greatly reduce our carbon footprint."
McCaffrey continued, "One recent study estimated that training a large deep learning model produces 626,000 pounds of carbon dioxide, which is about the same as the lifetime emissions from five automobiles. It's becoming increasingly important for data scientists and ML researchers to do what they can to reduce carbon footprint."