How-To
Machine Learning Image Techniques for Biology Problems
- By Pure AI Editors
- 11/05/2020
Bioinformatics uses mathematical and computational techniques for analyzing biological data. Examples include gene prediction (predicting the location of protein-encoding genes within a given DNA sequence) and proteomics (predicting the structure of a protein by analyzing the amino acid sequence directly).
The application of machine learning and artificial intelligence (AI) techniques to biology research has increased dramatically over the past 24 months. According to data from the National Center for Biotechnology Information, in the 40 years since 1980 approximately 65,000 biology research papers related to ML/AI have been published. Of these, over half (approximately 36,000 papers) have been published in just the last 24 months alone. The graph in Figure 1 shows the growth of ML/AI-related biology research.
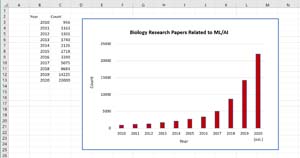 [Click on image for larger view.] Figure 1: Number of biology research papers related to machine learning and artificial intelligence techniques.
A relatively new machine learning approach for bioinformatics is the use of image processing and recognition techniques. Developing a new drug or vaccine often takes years and can cost hundreds of millions of dollars. The process is complex and extremely labor intensive. Digital biology companies are applying ML/AI image processing techniques to biology problems with the idea that these techniques can decrease, by orders of magnitude, the amount of time and money required to develop new drugs.
In much the same way that large image datasets such as MNIST (handwritten digits) and CIFAR-100 (object types such as dog, airplane, and man) stimulated rapid advances in general image recognition and processing techniques, large biology image datasets are expected to stimulate breakthroughs in biological problem domains.
One of several large biology image datasets is the RxRx1 set. The dataset was published in 2019 and consists of 125,510 images in PNG format. Each image is 512 x 512 pixels where each pixel is a grayscale value between 0 and 255. The RxRx1 file size is approximately 46 GB.
The images in Figure 2 show the first set of six related images from the RxRx1 dataset. All six images represent the same collection of HUVEC (human umbilical vein cells) cells that have been subjected to a specific biological agent called an siRNA. Six stains were applied. Each stain targets six different parts of the cells and then fluorescent microscopy was used to illuminate the targeted cell parts: nucleus, endoplasmic reticulum, actin cytoskeleton, nucleolus, mitochondria and Golgi apparatus.
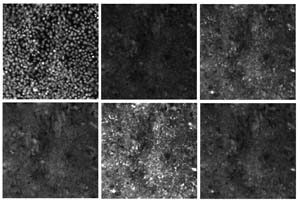 [Click on image for larger view.] Figure 2: The first six images in the RxRx1 dataset. All six images represent the same collection of HUVEC cells.
The images in Figure 3 show six RxRx1 images of a collection of cells where false color has been applied to the pixel values to make the images easier to see. From left to right: cell nuclei (blue), endoplasmic reticuli (green), cell actin (red), nucleoli (cyan), mitochondria (magenta), Golgi apparatus (brownish yellow). If you look closely at the bottom-right corner of each of the six images you should be able to see different parts of the same cell.
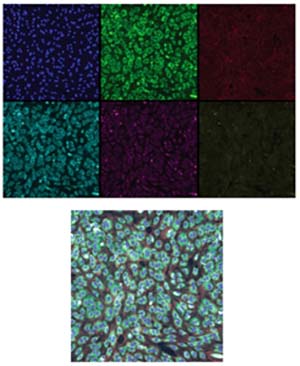 [Click on image for larger view.] Figure 3: Top: Six RxRx1 images with false color applied. Bottom: A composite of the six images. Source: https://www.rxrx.ai
The bottom image in Figure 3 is a composite of the six component images. The RxRx1 dataset does not contain such composite images; composite images are often shown in research papers in place of the component images to save space.
Each set of six related images in the RxRx1 dataset depends on five factors: cell type, siRNA type, microplate, well location and well sample location. There are four cell types represented in the dataset: HUVEC, RPE (retinal pigment epithelium), U2OS (human bone osteosarcoma epithelial line), and HepG2 (human liver cancer cell line).
The treatment applied to produce the RxRx1 images is introducing siRNA (small interfering RNA) to cells. Briefly, applying siRNA limits the ability of the DNA in the cells to produce proteins. This limiting process is called knockdown. The image data was generated from a total of 1,138 different siRNA, but 30 of these were controls, leaving 1,108 treatment siRNA types. Each siRNA produces visual changes in the cells to which the siRNA is applied. However, the visual representations (called phenotypes) are difficult or impossible to detect using the human eye. This is where ML/AI techniques come into play. The four images shown in Figure 4 show examples of the same siRNA type applied to each of the four different cell types (UVEC, RPE, U2OS, HepG2).
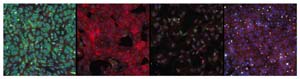 [Click on image for larger view.] Figure 4: Composite images of one of 1308 siRNA types applied to four different cell types. Source: https://www.rxrx.ai
The siRNA was applied to the four different cell types using 384-well microplates. You can think of one microplate as 384 individual, very small test tubes called wells. A standard 384-well microplate is approximately 5 inches wide by 3.33 inches tall. There are 16 rows (labeled A through P) and 24 columns (numbered 1 through 24). A schematic of a 384-well microplate is shown in Figure 5. The outer rows and columns of a microplate are more sensitive to environmental factors such as temperature and humidity, and so the RxRx1 data was generated using only the interior 14 rows (B through O) and 22 columns (2 through 23) yielding 14 * 22 = 308 wells per microplate.
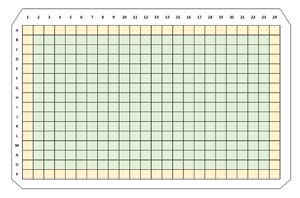 [Click on image for larger view.] Figure 5: A schematic of a 384-well microplate. The RxRx1 data was created using only the 308 interior wells (shown in green) to reduce environmental noise due to factors like temperature and humidity.
Conditions within a specific well on a microplate can vary depending upon the depth from which a sample is taken. The RxRx1 experiments extracted two samples from each well. Putting all this information together, the site ID meta-data for one RxRx1 image looks like "HUVEC-05_4_E04_2" which means the cell type is HUVEC, experiment #5, microplate #4, well location is row E column 04, sampling location #2. Additional meta-data includes the type of siRNA applied to the cells in the well.
To summarize, cells from one of four cell types were placed into one of 308 wells in one of four microplates, then one of 1,108 types of treatment siRNA or 30 control siRNA was introduced, and then a result sample was selected from one of two locations within the well. Each sample generated six 512 x 512 grayscale PNG images which emphasize different organelles in the cells.
The RxRx1 image data and similar datasets can be used in several different ways. Most data collected from the real world has noise. Biological data is especially noisy. Machine learning image processing techniques can be used to separate the effects of treatments, such as siRNA type, from experimental noise introduced by factors such as well location within a microplate. This information can in turn potentially be used for generalization via transfer learning and domain adaptation.
The RxRx1 data was generated by a commercial company named Recursion Pharmaceuticals. Recursion is a digital biology company that is developing a drug discovery platform and pipeline using machine learning. See more here.
The Pure AI editors asked ML engineering expert Dr. James McCaffrey from Microsoft Research about the use of image recognition and processing techniques for biological problems. He commented, "Decades ago, the creation of the internet led to remarkable advances in communication scenarios, many of which were quite unforeseen. I think it's safe to say that the application of ML techniques to biology scenarios will bring new breakthroughs, some of which will be very surprising and unexpected."
On a business-related note, McCaffrey added, "A big increase in research activity, such as the kind we're now seeing in ML techniques applied to biology, is often a leading indicator for business activity in the form of the creation of new forward-looking start-ups. I would not be surprised to see significantly increased business activity related to digital biology companies in the next 12 months."